I trace, you trace … what about dtrace?
Anyone who has been plugged into the OS scene is surely aware of the latest Mac OS X Leopardrelease. It is hard to miss since the news is pretty much splashing up all over the place in news articles and product reviews and in my case filling my mailbox with Google Alerts. I don’t have an alert set for Max OS X, but I do have one set for DTrace and this tracing functionality has now been included in the latest Mac OS X release and people seem to be pretty jazzed about it.
I’m jazzed about it too … but for a different reason all together.
Colin and I have been following the work of Bryan, Mike and Adamon dtrace since it was released as part of the Open Solaris. We head up most of the kernel instrumentation and system profilingdevelopment on Neutrino and have always felt that dtrace, with its focus on runtime safety and use in a production environment, would be a perfect match for embedded developers and compliment our existing instrumentation and tracing strategy for Neutrino very nicely.
So why were we jazzed by the Max OS X release? The more platforms that dtrace is ported to, the more generic the code base will become. It is exciting to us because now dtrace is running on Solaris, NetBSD, Max OS X and oh yeah … Neutrino!
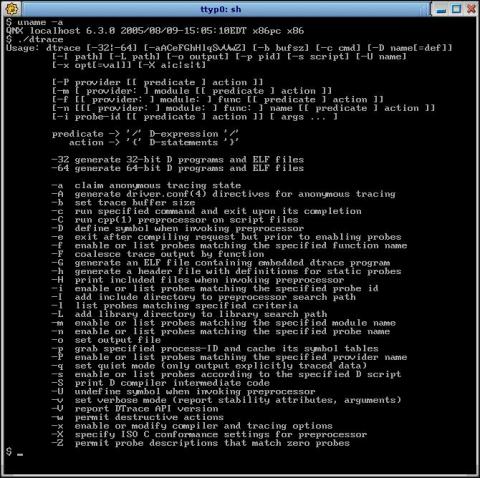
You can see here that this is a system that is running the 6.3.0 release of Neutrino and this is the basic dtrace command help. The initial port to Neutrino that Colin and I have done is slightly different from the other OS ports. Since Neutrino is an micro-kernel, we wanted to see how far we could go keeping the dtrace module out of the kernel … and if possible even outside of the process manager. The current implementation has all of the dtrace system code, normally found in the kernel or a kernel module, encapsulated in a resource manager, io-dtrace, and the utility is a straight port of the Solaris utility.
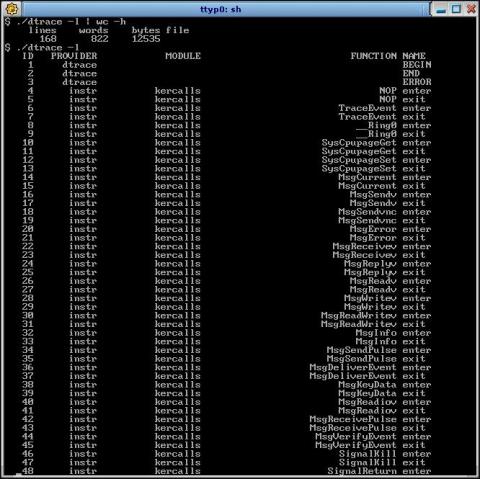
We’ve only implemented three sets of providers currently.
- dtrace: This is the standard dtrace provider with the BEGIN, END and ERROR probes
- instr: This is a provider based on the existing kernel instrumentation hook and can provide kernel calls, thread state, interrupt information
- profile: This provider is pretty much the same as the Solaris provider and provides statistical sampling at a user controlled rate
Even with this minimal set of providers, you can extract some pretty interesting information. For example, we can re-write the hogs utility, that tracks the runtime of the top few processes, with a simple dtrace script:

We are missing a lot of the standard dtrace built-ins that allow you to get much deeper into the application space, such as providing the user stack information, but even by recording the instruction pointer we can get some usefull information about where an application is spending its time … expanding on the idea of an application specific statistical profiler, we can gather information about the whole system or target just one process or thread:

Since dtrace can work directly with C constructs, we can pull in code directly from the Neutrino system headers. If you wanted to take a look at the kind of messaging operations that were going on in a process, you could write a script to catch all of the MsgSend’s via the instrumentation hook and decode the first few bytes of data based on the message header to determine what an application is doing:

Pretty cool huh! It is a nice extension to the capabilities of the System Profiler that provides the graphical analysis capabilities, but in a development environment back on the host.
There is still have a lot to do and the port is far from complete. Before we can go much further, we are likely going to have to do the kernel and/or process manager integration to be able to efficiently provide things like the equivalent of the pid provider and the function boundary tracing. The good news is that as a proof of concept this is already usefull … and so far architecturally independent (running on MIPS, SH, ARM, PPC and of course x86), although the hard bits are still ahead of us.
Hats off to Bryan, Mike and Adam for a wicked awesome technology and to Sun to making it available to the software development community. Since the port isn’t quite complete, certainly not production ready, Colin and I are hoping that we can get our prototype posted up to the Foundry27 QNX community site so that we aren’t the only ones who get a chance to play around with this.
Stay tuned …
Thomas (& Colin who is onsite with a customer … likely using the dtrace prototype right now)


Thomas and Colin,
Fantastic work! It’s great to see the ideas behind DTrace taking hold and the DTrace community growing. Let us know if you need help with the next providers.
It’s running on NetBSD ?? … you sure?
True … that should have been FreeBSD:
http://dtrace.what-creek.com/
[…] Dtrace de Sun ya ha sido posible ejecutarla en en un sistema QNX. Los encargados de este trabajo comentan que el mayor problema es adaptar esta herramienta para poder trabajar fuera del microkernel, […]
[…] I trace, you trace ? what about dtrace? – Dtrace is now available on QNX too. Coool. […]
[…] ports galore! Posted November 26, 2007 A couple of weeks ago I wrote about the port of dtrace that Colin and I have got up and running under Neutrino. For the most part, porting software […]
Ohh hh! . it’s useful inf. may i publish ?
[…] along, nothing to see here. Posted January 20, 2008 As some of you may know, Thomas and I have been working on a port of dtrace, mostly in our spare time. I was intrigued and […]
Fantastic work…
Thanks!,
Ну естественно, на самом деле так оно и есть. :)
wehrmacht photos,